Automated traffic enforcement is often framed as a compliance tool – cameras issue citations, behavior changes, and the program declares success. But the most sophisticated DOT programs have recognized something broader: the data generated by enforcement is as valuable as the enforcement itself. Speed profiles, violation hotspots, before-and-after behavior patterns, and long-term trend analysis all feed directly into infrastructure planning, project prioritization, and safety investment decisions. When enforcement and planning operate from the same data foundation, both functions work better.
Enforcement as a Data Infrastructure Problem
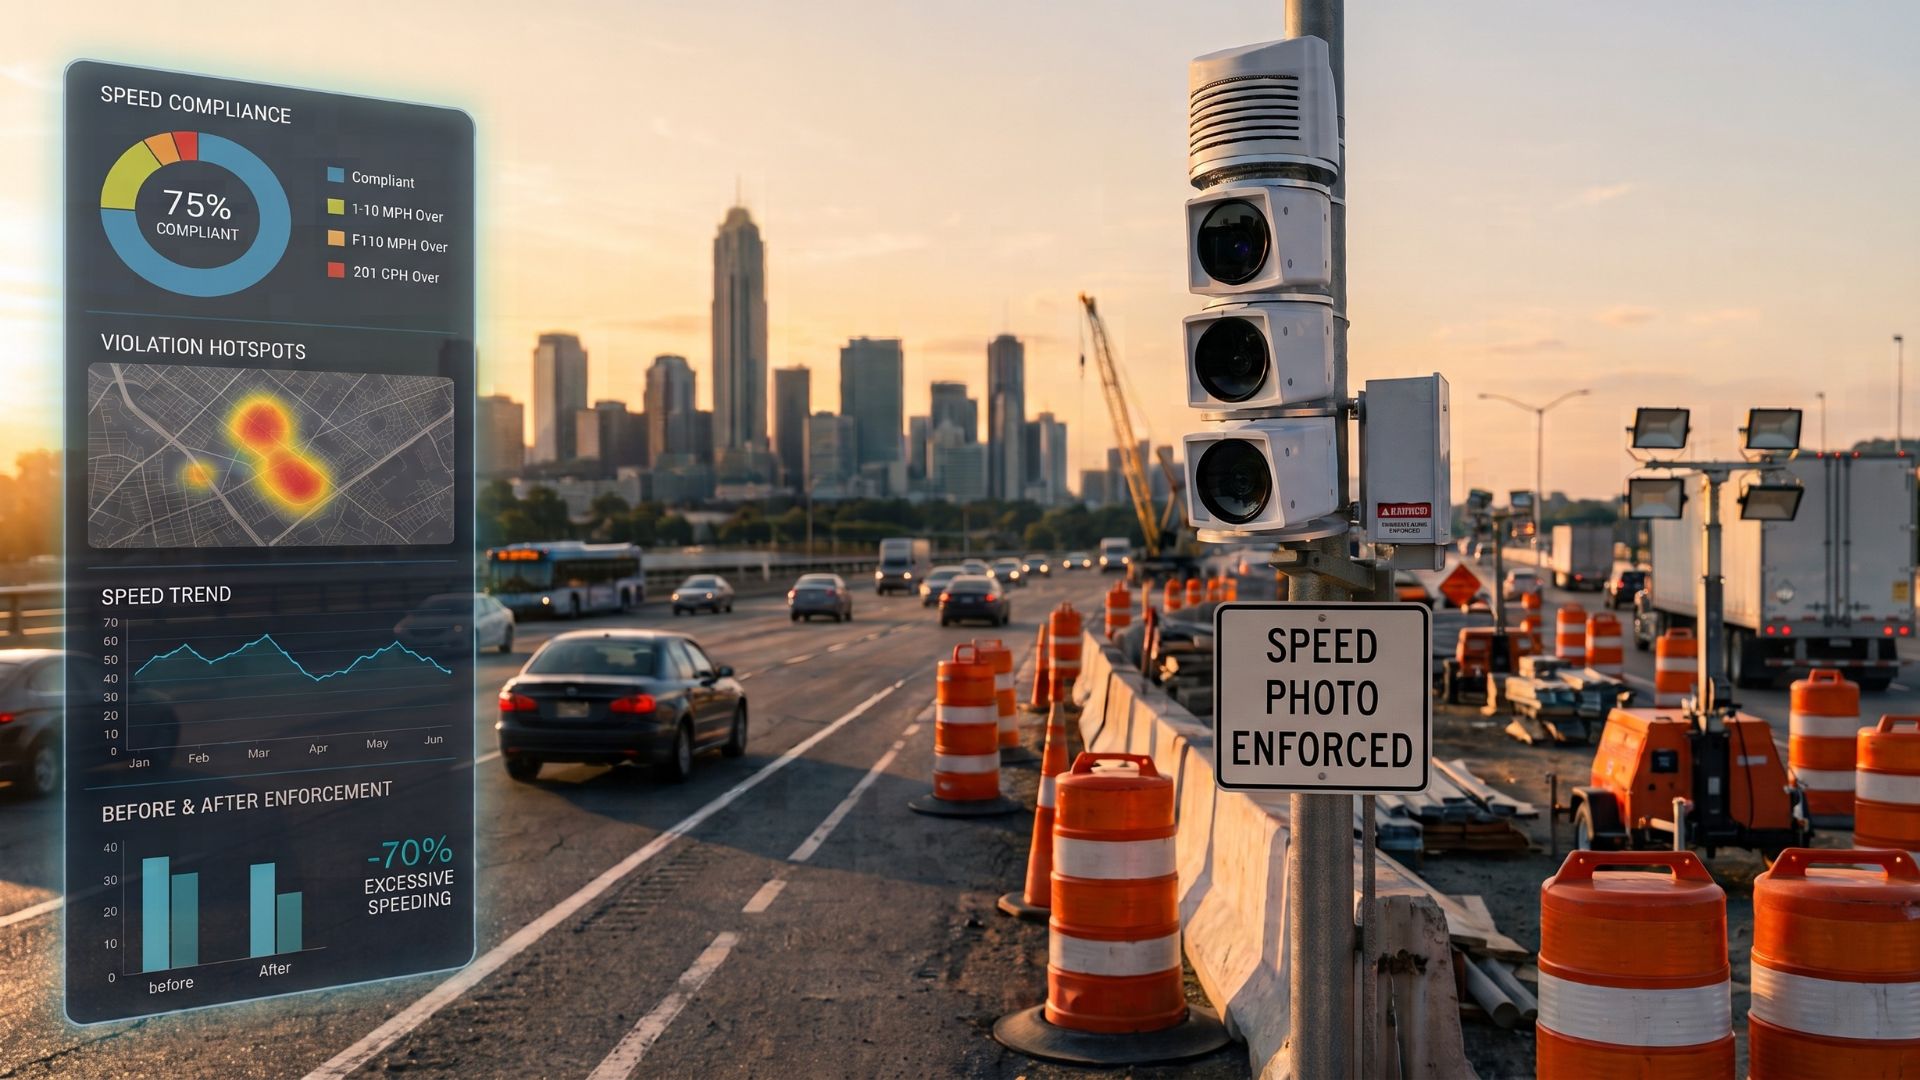
Every camera deployment produces a continuous stream of speed data. A work zone camera identifies violators, but it also records the full speed distribution of every passing vehicle: what percentage are compliant, what percentage are marginally over, and what percentage are dangerously fast. Over weeks and months, that record becomes one of the richest traffic datasets a DOT can have for a specific corridor.
Transportation planners historically have relied on periodic spot studies, tube counts, and modeled estimates to understand how traffic behaves on a given segment. Enforcement-grade cameras, deployed systematically and maintained by experienced program operators, can supplement – and sometimes replace – those point-in-time snapshots with continuous behavioral data at scale.
The practical implication: a DOT that treats enforcement as pure compliance misses the planning dividend. One that treats enforcement as data infrastructure captures it.
What the Pilots Are Showing
The most instructive current examples come from state DOT work zone programs that have published early results.
Indiana (INDOT Safe Zones)
INDOT launched its Safe Zones work zone speed enforcement pilot under House Enrolled Act 1015, beginning on Interstate 70 in Hancock County in August 2024 and expanding to additional sites through 2025. The program operates at up to four sites at a time and is explicitly structured as a five-year pilot — meaning data collection and evaluation are built into the program’s mandate, not treated as an afterthought. Early results from the I-465/I-69 Clear Path deployment showed a 75% reduction in excessive speeding in the first month of enforcement. Across existing sites, INDOT has documented approximately 70% reductions in excessive speed rates. These figures don’t just describe enforcement success — they establish pre- and post-deployment baselines that planners can use to assess driver behavior patterns across a specific corridor type, geometry, and traffic volume.
Learn more about Work Zone Speed Enforcement
Washington State (WSDOT Work Zone Speed Camera Program)
Washington’s program launched in April 2025 with a single camera trailer on Interstate 5 and expanded to six cameras rotating across 46 job sites across Western Washington by the end of its first year. A 2025 annual report documented an average 17% reduction in speeding across camera-equipped project sites, with some sites showing more pronounced effects. One project on I-405/State Route 522 sustained a 20% reduction in speeding even after camera deployment ended — suggesting a behavioral halo effect that persists beyond active enforcement. The program is now expanding into Central and Eastern Washington, with plans to operate up to 15 cameras by 2027. Legislators also strengthened the program in 2025, raising first-offense fines to $125 beginning July 1, 2026.
Both programs illustrate a critical planning insight: when speed reduction persists after cameras leave a site, it indicates genuine driver behavior change — the kind of outcome that supports arguments for roadway design modifications, revised speed limits, or reduced staffing requirements on similar corridors.
Translating Enforcement Data Into Planning Decisions
The connection between enforcement data and infrastructure planning is most direct in three areas:
- Site selection and prioritization. Speed violation rates, combined with crash data, give planners an objective basis for prioritizing safety investments on specific corridors. Segments that consistently show high violation rates may warrant geometric redesign, lighting improvements, or permanent speed infrastructure independent of the camera program.
- Evaluating countermeasure effectiveness. When enforcement is deployed before, during, and after a roadway modification, speed data provides a clean before-and-after comparison. That’s increasingly important for federal safety program reporting and HSIP project evaluation.
- Supporting grant and budget justifications. Programs in Maryland, Delaware, and Virginia have used enforcement outcomes — crash reductions, speed compliance rates, and citation trend data — to support federal safety grant applications and demonstrate program ROI to appropriators. Data-rich programs make those cases more convincingly than programs that only track citation volume.
Emerging Markets: New Programs, New Planning Opportunities
Michigan has authorized work zone speed camera enforcement under MDOT administration — one of a growing number of states moving from legislative concept to operational planning. The program structure includes an explicit mandate to evaluate results, signaling that data utility, not just compliance, is a design goal from the start.
Massachusetts, meanwhile, is on track for its first statewide ATE authorization. Governor Healey’s FY2026 budget proposal includes a speed camera enforcement framework, with Senate Bill 2344 having advanced through the Transportation Committee and now moving through the Senate Ways and Means Committee. If passed, MassDOT would have six months to promulgate program regulations — including data standards, site criteria, and equity requirements — before municipal programs could launch. The municipalities that begin crash data analysis, stakeholder alignment, and vendor evaluation now will be positioned to move quickly when procurement opens.
Alabama moves on a tighter timeline than either Michigan or Massachusetts. Governor Ivey signed SB 341 — the Work Zone Safety Act — in April 2026, with enforcement eligible to begin as early as November 16, 2026. The legislation also requires effectiveness data to be reported back to the Legislature, which means program evaluation isn’t a best practice for Alabama’s pilot: it’s a statutory obligation. For ALDOT and ALEA, that makes data architecture a program design requirement from day one.
Each of these programs will generate enforcement data from day one. How that data is structured, retained, and made available to planning functions depends largely on how the program is designed — and who operates it. Vendors with experience running large-scale programs across multiple enforcement types have already solved many of these problems: standardized data formats, proven integration pathways, and evaluation frameworks that produce usable outputs rather than raw citation logs. DOTs and law enforcement agencies launching new programs should ask early whether their vendor brings that infrastructure ready-made — or whether they’ll be building it alongside you.
What Good Program Design Looks Like
Long-tenured programs offer the clearest picture of what planning-integrated enforcement looks like in practice. Maryland’s SHA SafeZones work zone program and Delaware’s ESSP have both operated for over a decade, generating longitudinal speed and compliance data that informs not just enforcement decisions but corridor-level safety planning across both DOTs.
Responsible ATE vendors structure programs to support that kind of data utility from the start: standardized data formats compatible with DOT traffic management systems, transparent methodology for violation review and approval/rejection, clear chain of custody on all captured images and speed data, and readily available program evaluation reports that go beyond citation counts to document the impact of the ATE on the drivers behaviors through metrics such as average speed of vehicles passed, and average speed of violators. That’s the difference between a camera program and a data program. The camera issues the citation. The data informs the next 10 years of infrastructure decisions.
Why This Matters
Indiana and Washington have already demonstrated what data-first enforcement design produces: measurable behavior change, publishable results, and a program record that justifies continued investment. The agencies now building programs in Michigan, Alabama, and Massachusetts are in a position to learn from that track record rather than establish it from scratch. The decisions made in program design — how data is structured, retained, and connected to planning functions — will shape what those programs can accomplish well beyond their first year of deployment.
Frequently Asked Questions
Speed enforcement cameras generate continuous vehicle speed data across entire traffic populations — not just violators. Over time, that record reveals corridor-level behavior patterns, before-and-after compliance trends, and violation hotspots that planners can use to prioritize safety investments, evaluate countermeasure effectiveness, and support federal grant applications.
Active state DOT work zone programs include Indiana (INDOT Safe Zones, in pilot since August 2024), Washington (WSDOT Work Zone Speed Camera Program, launched April 2025 and expanding to 15 cameras statewide by 2027), Maryland (MDOT SHA SafeZones, long-running), Delaware (DelDOT ESSP), and Virginia (Virginia State Police statewide program). Michigan and Alabama have both authorized new programs expected to launch in 2026.
Beyond camera selection, new programs should prioritize data architecture from the start: standardized formats compatible with existing traffic management systems, clear retention and access policies, transparent methodology for violation review, and regular evaluation reporting that tracks speed distribution trends — not just citation volume. Programs designed this way produce planning value from day one, not just compliance outcomes.