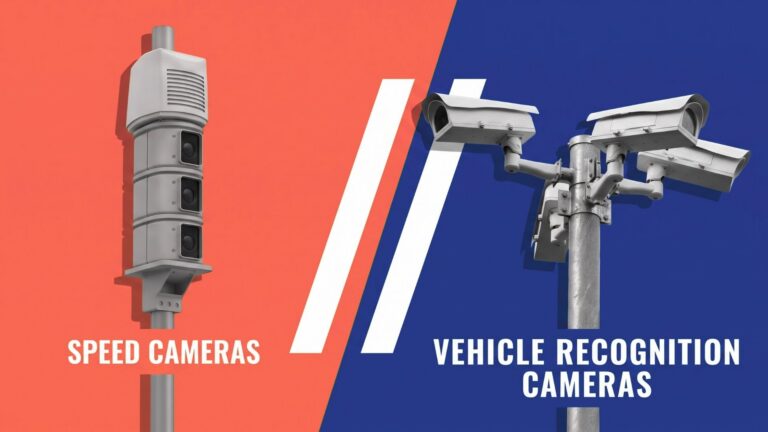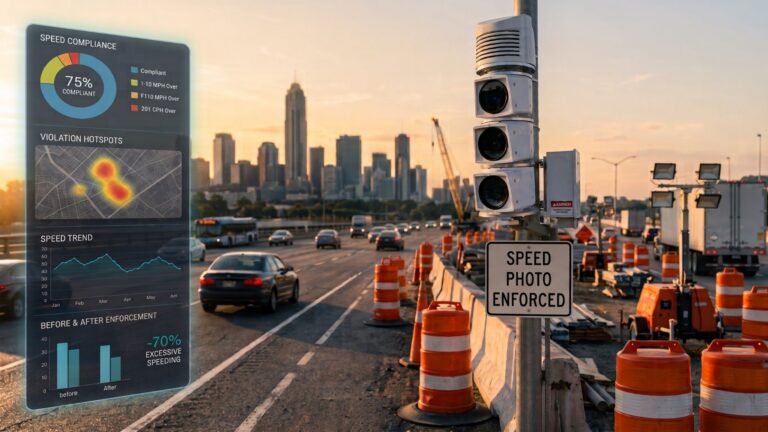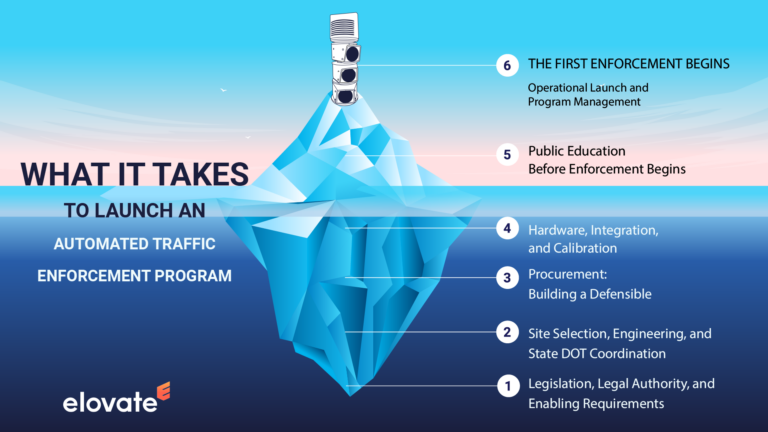
Agencies measure Automated Traffic Enforcement (ATE) safety outcomes against long-term goals, such as Vision Zero targets that take years of crash data to read. Vendors supply the month-to-month record that fills the gap, covering speeds, repeat violations, and camera uptime. Recent reports from Delaware, Indiana, and Washington State show how the two fit together, and which numbers hold up when a council member or reporter asks whether a program is working.
Start With Speeds: ATE Safety Outcomes You Can Measure in Weeks
FHWA includes speed safety cameras among its Proven Safety Countermeasures, so the local question is what shows up in an agency’s own data. Crash counts at a single work zone are small, and small counts swing. Delaware’s 2025 work zone report shows this. On I-95 at SR 896, total crashes fell 15%, and injury crashes fell 9% by monthly rate, compared with the closest comparable period before enforcement. On SR 1 southbound, the report shows a 70% drop in injury crashes, but that figure rests on 2.5 months of data and a single injury crash, and DelDOT itself cautions that short periods and low counts cause significant fluctuations.
Speeds gave DelDOT a stronger read. Average speeds at the I-95 cameras fell 11.3% northbound and 9.9% southbound, and southbound SR 1 saw an 8.6% reduction against pre-construction conditions. The I-95 baseline was roughly one week of pre-warning recordings.
Indiana’s work zone pilot shows how far speed measurement can go. Purdue University and INDOT researchers analyzed about 100 million passenger-vehicle records and 3 million truck records from connected-vehicle providers across 443 deployment days at four interstate work zones. On weekdays between 6 AM and 6 PM, the share of passenger vehicles traveling 11 mph or more over the limit fell 34% on average, and the share of trucks fell 41%. Reductions also appeared overnight, when no enforcement units were on site. Because the data came from third-party providers outside the enforcement system, the cameras were not grading their own results. The study measured speeds, not crashes, and its authors list crash analysis as future work.
Washington State DOT chose its primary metric on purpose. Its 2025 annual report tracks the percentage of vehicles over the excessive-speed threshold, because average speed can hide the outliers enforcement targets. Across four projects, that percentage fell 17% on average, and by as much as 38% at zones with sustained enforcement. WSDOT notes that crash data had not yet been formally evaluated.
Read Crash Data by Severity, Not Only by Total
Delaware’s red-light report shows why. Across 46 monitored intersections, angle crashes fell 40% and red-light-running crashes fell 22%, and at the 16 intersections with severity data, suspected serious injury crashes dropped 68%. DelDOT also reports that total crashes rose 7% and rear-end crashes rose 9%, the moderate increase in typically less severe crashes it says monitoring can bring, and it notes that a 2010 change in its crash-reporting system complicates before-and-after totals. Angle crashes are typically the most severe type, and a report that shows both sides gives council members and community advocates a record they can check for themselves.
School zone programs show how these numbers move over time. In Fairfax County’s pilot, average speeds in zones posted at 25 mph fell from 31.9 to 26.3 mph in the first months and stood at 27.6 mph by February 2024, still roughly 13% below where they started. Howard County Police compared school zone collisions with a five-year baseline from before the program. The reported reduction was 24% in 2016 and 31% in 2021, when the county noted that lower traffic from COVID restrictions likely contributed, and about 21% in recent reporting, still a fifth below the pre-program baseline.
Track Repeat Violations and Citation Trends
Repeat behavior shows whether drivers are changing. Albuquerque reports that through July 2026, 70.1% of cited vehicles received one citation and 29.9% received two or more. Across the program’s first 20 cameras, the share of drivers going more than 10 mph over the limit fell between 54.7% and 96.2%, and average speeds dropped 0.6 to 8.8 mph. Washington reported an 8% repeat rate through September 2025 and set a goal of a long-term plateau or decline as the program grows. Maryland’s State Highway Administration told Engineering News-Record that work zone crashes fell 12% in 2025, to 1,148, and that the nine work zone fatalities were down 25% while zero occurred at an enforced site since start of the program. In Baltimore City, an Elovate analysis of 1.28 million red-light citation records from 2020 to 2025 found a 54% reduction in the most dangerous violations.
What These Measures Say About the Revenue Question
Citation trends answer the revenue question only when read per site and per vehicle. At a location with unchanged equipment, violations should fall as drivers adjust, and the share of vehicles violating should fall faster than any count. Maryland’s State Highway Administration reported that about seven in 100 drivers in targeted work zones exceeded the limit by 12 mph or more when its program began, and fewer than one in 100 later. In 2025, SHA told ENR that citations fell 17% statewide even as it added cameras. Baltimore City’s Department of Transportation reported in 2020 that red-light cameras with a full year of service showed 51% fewer violations.
Published measures also answer the revenue question. Delaware’s work zone report states that revenue beyond operating costs is managed by its Office of Highway Safety and may be used only for transportation safety purposes. Albuquerque told a New Mexico legislative committee in September that the city first pays program costs and state-required payments, then spends the remainder on traffic safety projects listed on a public map. Washington’s report says program revenue had been limited through September 2025 because few drivers repeated the behavior, and first infractions carried no fine until July 2026. In each case, the safety measures and the funding rules sit in the same public document.
Why This Matters
Delaware, Indiana, and Washington each launched work zone enforcement under five-year pilot authority, and Delaware and Washington publish annual reports. For an agency preparing a renewal or an extension request, the measurement plan is part of the case. Agreeing on those measures before the first camera goes live lets an agency report what changed and say plainly what the data cannot yet show.
Check out our ATE Impact Calculator to estimate the potential safety impact of automated speed enforcement for your community.
Frequently Asked Questions
Start with the share of vehicles exceeding the enforcement threshold, such as 10 or 11 mph over the limit. It moves within weeks, captures the outliers that enforcement targets, and avoids the small-count problem that makes early crash comparisons unreliable. Pair it with average speed and, over time, crash severity.
Speed changes appear within weeks, but crash trends take longer. DelDOT’s red-light analysis compares three years before with roughly nine to nineteen years after, while its newest work zone sites report only months of data and caution that low counts fluctuate. Most agencies treat crash results as multi-year evidence.
Agencies own the goals, policy, and outcomes. The vendor supplies the operating record: speeds, violations, repeat rates, and deployment logs. In Indiana, those logs let Purdue researchers match independent speed data to enforcement days, giving the agency a shared evidence base for judging a program on safety results.